In the previous article, we showed how to use the SqlBak API to automate backup health checks: detecting failed jobs, offline servers, missing recent backups, and retention policy issues. The next logical step is to bring that data into Grafana so backup monitoring becomes part of your overall observability stack alongside CPU, RAM, disks, and other infrastructure metrics.
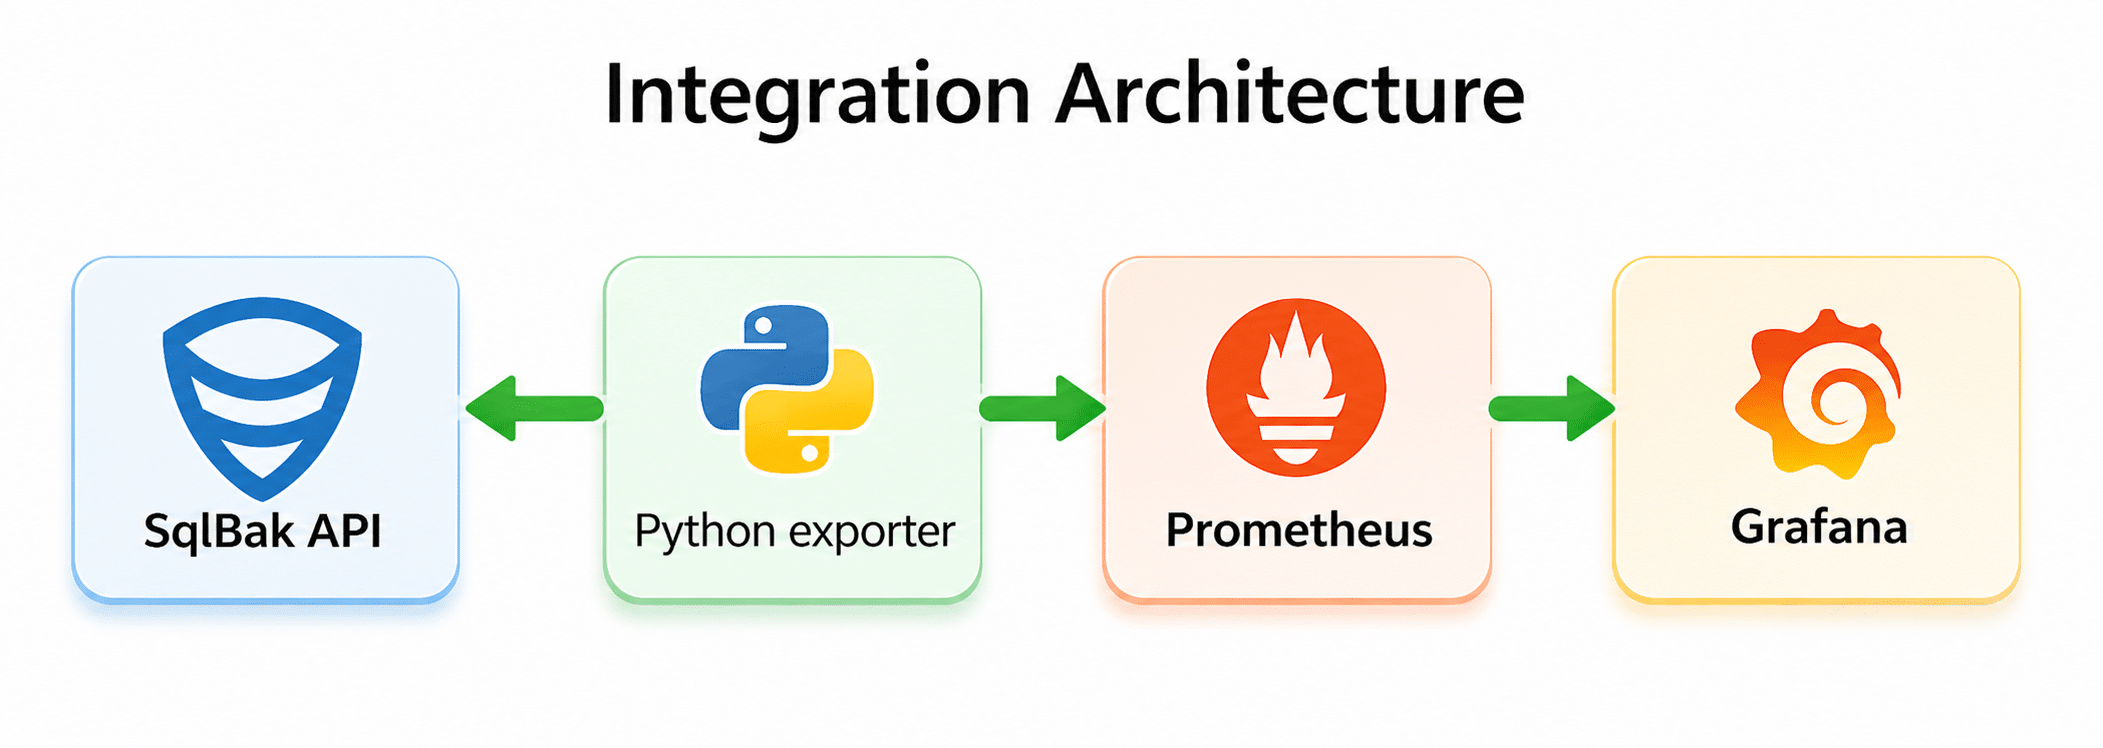
In this article, we’ll show how to connect SqlBak to Grafana using a custom Python Prometheus exporter. The exporter polls the SqlBak API, converts the results into Prometheus metrics, and exposes them on an HTTP /metrics endpoint. Prometheus scrapes that endpoint, and Grafana uses those metrics for dashboards and alerts.
Integration architecture
The setup looks like this:
In practice:
- The Python exporter periodically calls the SqlBak API.
- It collects data about servers, jobs, job runs, and retention settings.
- It exposes that data as Prometheus metrics.
- Prometheus scrapes the exporter endpoint.
- Grafana visualizes the metrics and sends alerts.
This approach works especially well if you already have Prometheus and Grafana in place. You do not need a separate backup monitoring system — you just plug SqlBak into your existing monitoring pipeline.
What we are going to monitor
This exporter collects several groups of metrics.
At the server level:
- online/offline status;
- total number of offline servers;
- last successful exporter check timestamp;
- availability of the
jobrunsandjob settingsAPI endpoints.
At the job and backup-type level:
- retention policy in days;
- whether undeleted backups older than the retention policy still exist;
- hours since the last successful backup;
- number of successful backups;
- number of failed backups;
- total number of backups in the inspected window;
- a summary metric for easier Grafana table building.
1. Prepare your API token
The exporter authenticates with the header: X-SqlBak-Token: YOUR_API_TOKEN
You can generate an API token in your SqlBak account:
- Go to https://sqlbak.com/account → Developers tab → Create API key…
- Click Generate token
- Copy the token and store it securely
The token should be stored in an environment variable: export SQLBAK_API_TOKEN="YOUR_API_TOKEN"
Do not hardcode the token in the script. If the token has already appeared in a repository, chat, screenshot, or documentation, treat it as compromised and rotate it.
2. Install dependencies
You need Python 3 and two libraries: pip install requests prometheus_client
3. Create the exporter
The exporter below:
- fetches servers via
/servers; - fetches jobs via
/jobs; - reads job settings via
/jobs/{job_id}/settings; - fetches job run history via
/jobruns; - reads detailed job run data via
/jobruns/{jobrun_id}; - converts everything into Prometheus metrics;
- exposes the result on an HTTP
/metricsendpoint.
Exporter code
import os
import time

import requests
from prometheus_client import Gauge, start_http_server


API_TOKEN = os.getenv("SQLBAK_API_TOKEN")
CHECK_INTERVAL = int(os.getenv("CHECK_INTERVAL", "60"))
EXPORTER_PORT = int(os.getenv("EXPORTER_PORT", "8000"))

# How many hours back the exporter looks when reading job run history.
# Default: 168 hours = 7 days.
#
# The exporter may automatically extend this window when retention settings
# require checking older backups.
JOBRUNS_LOOKBACK_HOURS = int(os.getenv("JOBRUNS_LOOKBACK_HOURS", "168"))

BASE_URL = "https://sqlbak.com/public-api/v1"


# The exporter exposes the following Prometheus metrics:
#
# Server-level:
# - sqlbak_server_online
# - sqlbak_offline_servers_total
# - sqlbak_jobruns_available
# - sqlbak_jobsettings_available
# - sqlbak_last_check_timestamp
#
# Job-level:
# - sqlbak_job_retention_days
# - sqlbak_job_has_backups_older_than_policy
# - sqlbak_job_last_success_age_hours
# - sqlbak_job_backups_succeeded_total
# - sqlbak_job_backups_failed_total
# - sqlbak_job_backups_total
#
# Grafana helper:
# - sqlbak_job_summary


# ---------- Common metrics ----------

server_online = Gauge(
    "sqlbak_server_online",
    "Server online status (1=online, 0=offline)",
    ["server_id", "server_name", "app_type"]
)

offline_servers_gauge = Gauge(
    "sqlbak_offline_servers_total",
    "Number of offline servers"
)

jobruns_available_gauge = Gauge(
    "sqlbak_jobruns_available",
    "Whether jobruns endpoint is available (1=yes, 0=no)"
)

jobsettings_available_gauge = Gauge(
    "sqlbak_jobsettings_available",
    "Whether job settings endpoint is available (1=yes, 0=no)"
)

last_check_gauge = Gauge(
    "sqlbak_last_check_timestamp",
    "Last check timestamp"
)


# ---------- Per-job metrics ----------

job_retention_days_gauge = Gauge(
    "sqlbak_job_retention_days",
    "Retention policy in days for the job and backup type",
    ["server_name", "job_name", "job_id", "server_id", "backup_type"]
)

job_has_backups_older_than_policy_gauge = Gauge(
    "sqlbak_job_has_backups_older_than_policy",
    "Whether job has undeleted backups older than retention policy (1=yes, 0=no)",
    ["server_name", "job_name", "job_id", "server_id", "backup_type"]
)

job_last_success_age_hours_gauge = Gauge(
    "sqlbak_job_last_success_age_hours",
    "Hours since last successful backup for backup type",
    ["server_name", "job_name", "job_id", "server_id", "backup_type"]
)

job_success_count_gauge = Gauge(
    "sqlbak_job_backups_succeeded_total",
    "Number of successful backups in the inspected window",
    ["server_name", "job_name", "job_id", "server_id", "backup_type"]
)

job_failed_count_gauge = Gauge(
    "sqlbak_job_backups_failed_total",
    "Number of failed backups in the inspected window",
    ["server_name", "job_name", "job_id", "server_id", "backup_type"]
)

job_total_count_gauge = Gauge(
    "sqlbak_job_backups_total",
    "Total number of backups in the inspected window",
    ["server_name", "job_name", "job_id", "server_id", "backup_type"]
)

# sqlbak_job_summary is not a separate business metric.
# It duplicates selected values in a format that is easier to use in Grafana tables.
job_summary_gauge = Gauge(
    "sqlbak_job_summary",
    "Helper metric for building compact Grafana tables",
    ["row_key", "server_name", "job_name", "job_id", "server_id", "backup_type", "metric"]
)


def api_get(path, params=None):
    headers = {"X-SqlBak-Token": API_TOKEN}
    response = requests.get(
        f"{BASE_URL}{path}",
        headers=headers,
        params=params or {},
        timeout=30
    )
    response.raise_for_status()
    return response.json()


def get_all_servers():
    all_servers = []
    page = 1

    while True:
        payload = api_get("/servers", params={"page": page, "page_size": 100})
        data = payload.get("data", {})
        servers = data.get("list", [])

        all_servers.extend(servers)

        if not data.get("has_more"):
            break

        page += 1

    return all_servers


def get_all_jobs():
    all_jobs = []
    page = 1

    while True:
        payload = api_get("/jobs", params={"page": page, "page_size": 100})
        data = payload.get("data", {})
        jobs = data.get("list", [])

        all_jobs.extend(jobs)

        if not data.get("has_more"):
            break

        page += 1

    return all_jobs


def get_job_settings(job_id):
    payload = api_get(f"/jobs/{job_id}/settings")
    return payload.get("data", {})


def get_jobruns_for_job(job_id, started_after_ms):
    all_jobruns = []
    page = 1

    while True:
        payload = api_get(
            "/jobruns",
            params={
                "job_id": job_id,
                "started_after": started_after_ms,
                "page": page,
                "page_size": 100
            }
        )

        data = payload.get("data", {})
        jobruns = data.get("list", [])

        all_jobruns.extend(jobruns)

        if not data.get("has_more"):
            break

        page += 1

    return all_jobruns


def get_jobrun_details(jobrun_id):
    payload = api_get(f"/jobruns/{jobrun_id}")
    return payload.get("data", {})


# SqlBak API returns detailed backup type names.
# For Prometheus labels we normalize them to short values:
#
# database_full            -> full
# database_differential    -> diff
# database_transaction_log -> log
# database_incremental     -> inc
# folder                   -> folder
def normalize_backup_type(raw_value):
    v = str(raw_value or "").strip().lower()

    if v == "database_full":
        return "full"
    if v == "database_differential":
        return "diff"
    if v == "database_transaction_log":
        return "log"
    if v == "database_incremental":
        return "inc"
    if v == "folder":
        return "folder"

    return "unknown"


def get_enabled_backup_types_from_settings(job_settings):
    result = set()
    schedule = job_settings.get("schedule_settings") or {}

    if "database_full" in schedule:
        result.add("full")

    if (schedule.get("database_differential") or {}).get("is_enabled"):
        result.add("diff")

    if (schedule.get("database_transaction_log") or {}).get("is_enabled"):
        result.add("log")

    if (schedule.get("database_incremental") or {}).get("is_enabled"):
        result.add("inc")

    folders = job_settings.get("folders_backup_settings") or {}

    for raw_type in folders.get("backup_types", []):
        result.add(normalize_backup_type(raw_type))

    if not result:
        result.add("full")

    return sorted(result)


def months_days_to_days(months, days):
    try:
        m = int(months or 0)
    except (TypeError, ValueError):
        m = 0

    try:
        d = int(days or 0)
    except (TypeError, ValueError):
        d = 0

    return m * 30 + d


def get_retention_days_for_type(job_settings, backup_type):
    destinations = job_settings.get("destinations") or []
    values = []

    for dst in destinations:
        if backup_type == "full":
            days = months_days_to_days(
                dst.get("full_backups_keep_months"),
                dst.get("full_backups_keep_days")
            )
        elif backup_type in ("diff", "log", "inc"):
            days = months_days_to_days(
                dst.get("inc_backups_keep_months"),
                dst.get("inc_backups_keep_days")
            )
        else:
            days = 0

        values.append(days)

    return max(values) if values else 0


def has_not_deleted_files(backup_entry):
    uploads = backup_entry.get("uploads") or []
    found_file = False

    for upload in uploads:
        files = upload.get("files") or []

        for f in files:
            found_file = True

            if not bool(f.get("is_deleted", False)):
                return True

    if found_file:
        return False

    return str(backup_entry.get("status", "")).strip().lower() == "succeeded"


def update_server_metrics(servers):
    offline = 0
    server_online.clear()

    for s in servers:
        sid = str(s.get("id", ""))
        name = str(s.get("name", "unknown"))
        app = str(s.get("app_type", "unknown"))
        status = str(s.get("status", "")).strip().lower()

        val = 1 if status == "online" else 0

        if val == 0:
            offline += 1

        server_online.labels(
            server_id=sid,
            server_name=name,
            app_type=app
        ).set(val)

    offline_servers_gauge.set(offline)


def update_job_metrics(jobs, server_map):
    now_ms = int(time.time() * 1000)

    job_retention_days_gauge.clear()
    job_has_backups_older_than_policy_gauge.clear()
    job_last_success_age_hours_gauge.clear()
    job_success_count_gauge.clear()
    job_failed_count_gauge.clear()
    job_total_count_gauge.clear()
    job_summary_gauge.clear()

    jobsettings_available_gauge.set(1)
    jobruns_available_gauge.set(1)

    for job in jobs:
        job_id_raw = job.get("id")

        if not job_id_raw:
            continue

        job_id = str(job_id_raw)
        job_name = str(job.get("name", "unknown"))
        server_id = str(job.get("server_id", ""))
        server_name = server_map.get(server_id, "unknown")

        try:
            job_settings = get_job_settings(job_id_raw)
        except Exception as e:
            print(f"[WARN] failed to fetch job settings for job_id={job_id}: {e}")
            jobsettings_available_gauge.set(0)
            job_settings = {}

        enabled_backup_types = get_enabled_backup_types_from_settings(job_settings)

        retention_by_type = {
            bt: get_retention_days_for_type(job_settings, bt)
            for bt in enabled_backup_types
        }

        max_retention_days = max(retention_by_type.values() or [0])

        # Retention checks may require looking further back than JOBRUNS_LOOKBACK_HOURS.
        # For example, if retention is 30 days, the exporter needs job runs older than
        # 30 days to detect backups that should have been deleted.
        #
        # We add 7 extra days as a safety margin.
        effective_lookback_hours = max(
            JOBRUNS_LOOKBACK_HOURS,
            (max_retention_days + 7) * 24
        )

        started_after_ms = now_ms - effective_lookback_hours * 60 * 60 * 1000

        try:
            jobruns = get_jobruns_for_job(job_id_raw, started_after_ms)
        except Exception as e:
            print(f"[WARN] failed to fetch jobruns for job_id={job_id}: {e}")
            jobruns_available_gauge.set(0)
            jobruns = []

        stats = {}

        for bt in enabled_backup_types:
            stats[bt] = {
                "succeeded": 0,
                "failed": 0,
                "total": 0,
                "last_success_time": None,
                "has_old_backups": 0,
            }

        for jr in jobruns:
            jobrun_id = jr.get("id")

            if not jobrun_id:
                continue

            try:
                details = get_jobrun_details(jobrun_id)
            except Exception as e:
                print(f"[WARN] failed to fetch jobrun details jobrun_id={jobrun_id}: {e}")
                continue

            run_started_at = details.get("started_at")
            backups = details.get("backups") or []

            for b in backups:
                backup_type = normalize_backup_type(b.get("backup_type"))

                # This exporter focuses on database backups.
                # Folder backups are skipped in job-level statistics.
                if backup_type == "folder":
                    continue

                if backup_type not in stats:
                    stats[backup_type] = {
                        "succeeded": 0,
                        "failed": 0,
                        "total": 0,
                        "last_success_time": None,
                        "has_old_backups": 0,
                    }

                    if backup_type not in retention_by_type:
                        retention_by_type[backup_type] = get_retention_days_for_type(
                            job_settings,
                            backup_type
                        )

                backup_status = str(b.get("status", "")).strip().lower()
                stats[backup_type]["total"] += 1

                if backup_status == "succeeded":
                    stats[backup_type]["succeeded"] += 1

                    if isinstance(run_started_at, (int, float)):
                        last_success = stats[backup_type]["last_success_time"]

                        if last_success is None or run_started_at > last_success:
                            stats[backup_type]["last_success_time"] = run_started_at

                    retention_days = retention_by_type.get(backup_type, 0)

                    if isinstance(run_started_at, (int, float)):
                        age_days = (now_ms - run_started_at) / (1000 * 60 * 60 * 24)

                        if (
                            retention_days > 0
                            and age_days > retention_days
                            and has_not_deleted_files(b)
                        ):
                            stats[backup_type]["has_old_backups"] = 1

                elif backup_status == "failed":
                    stats[backup_type]["failed"] += 1

        all_backup_types = sorted(set(enabled_backup_types) | set(stats.keys()))

        for backup_type in all_backup_types:
            retention_days = int(retention_by_type.get(backup_type, 0))

            type_stats = stats.get(
                backup_type,
                {
                    "succeeded": 0,
                    "failed": 0,
                    "total": 0,
                    "last_success_time": None,
                    "has_old_backups": 0,
                }
            )

            last_success_time = type_stats.get("last_success_time")

            if last_success_time is not None:
                last_success_age_hours = (now_ms - last_success_time) / (1000 * 60 * 60)
            else:
                last_success_age_hours = -1

            label_values = {
                "server_name": server_name,
                "job_name": job_name,
                "job_id": job_id,
                "server_id": server_id,
                "backup_type": backup_type,
            }

            job_retention_days_gauge.labels(**label_values).set(retention_days)
            job_has_backups_older_than_policy_gauge.labels(**label_values).set(
                type_stats["has_old_backups"]
            )
            job_last_success_age_hours_gauge.labels(**label_values).set(
                last_success_age_hours
            )
            job_success_count_gauge.labels(**label_values).set(type_stats["succeeded"])
            job_failed_count_gauge.labels(**label_values).set(type_stats["failed"])
            job_total_count_gauge.labels(**label_values).set(type_stats["total"])

            row_key = f"{server_name}|{job_name}|{backup_type}"

            summary_labels = {
                "row_key": row_key,
                **label_values,
            }

            job_summary_gauge.labels(
                **summary_labels,
                metric="retention_days"
            ).set(retention_days)

            job_summary_gauge.labels(
                **summary_labels,
                metric="last_success_age_hours"
            ).set(last_success_age_hours)

            job_summary_gauge.labels(
                **summary_labels,
                metric="old_backups"
            ).set(type_stats["has_old_backups"])


def collect_metrics():
    servers = get_all_servers()
    jobs = get_all_jobs()

    server_map = {
        str(s.get("id")): str(s.get("name", "unknown"))
        for s in servers
    }

    update_server_metrics(servers)
    update_job_metrics(jobs, server_map)

    last_check_gauge.set(time.time())


def main():
    if not API_TOKEN:
        raise ValueError("Set SQLBAK_API_TOKEN env variable")

    start_http_server(EXPORTER_PORT)
    print(f"Exporter running on http://localhost:{EXPORTER_PORT}/metrics")

    while True:
        try:
            collect_metrics()
        except Exception as e:
            print(f"[ERROR] {e}")
            last_check_gauge.set(time.time())

        time.sleep(CHECK_INTERVAL)


if __name__ == "__main__":
    main()
What this exporter does
This exporter runs as a long-lived process rather than a one-time batch script.
After startup it:
- opens an HTTP endpoint, usually
:8000/metrics; - refreshes data every
CHECK_INTERVALseconds; - calls the SqlBak API;
- recalculates metric values;
- exposes them in Prometheus format.
That makes it simpler to set up than a textfile collector plus cron. You only need one service.
Exported metrics
The exporter exposes the following Prometheus metrics.
Server-level metrics:
sqlbak_server_online – server status. 1 means online, 0 means offline.
sqlbak_offline_servers_total – total number of offline servers.
sqlbak_jobruns_available – whether the jobruns API endpoint is available (1 = OK, 0 = error).
sqlbak_jobsettings_available – whether the job settings API endpoint is available (1 = OK, 0 = error).
sqlbak_last_check_timestamp – Unix timestamp of the last exporter check.
Job-level metrics:
sqlbak_job_retention_days – retention policy in days for the job and backup type.
sqlbak_job_has_backups_older_than_policy – whether undeleted backups older than the retention policy exist (1 = yes, 0 = no).
sqlbak_job_last_success_age_hours – hours since the last successful backup. Value -1 means no successful backups were found.
sqlbak_job_backups_succeeded_total – number of successful backups in the inspected window.
sqlbak_job_backups_failed_total – number of failed backups in the inspected window.
sqlbak_job_backups_total – total number of backups in the inspected window.
Summary metric:
sqlbak_job_summary – helper metric for building compact Grafana tables. This is not a separate business metric — it duplicates selected values in a format that is easier to use in Grafana.
Labels:
Most job-level metrics use the following labels:
server_name
job_name
job_id
server_id
backup_type
The backup_type label can be one of:
full
diff
log
inc
Metrics are calculated separately for each backup type.
4. Save and run the exporter
For example, save the script as:
/opt/sqlbak/sqlbak_grafana_exporter.py
Then set the environment variables:
export SQLBAK_API_TOKEN="YOUR_API_TOKEN"
export CHECK_INTERVAL="60"
export EXPORTER_PORT="8000"
export JOBRUNS_LOOKBACK_HOURS="168"
And start it:
python3 /opt/sqlbak/sqlbak_grafana_exporter.py
Once it is running, metrics will be available at http://localhost:8000/metrics
# HELP python_gc_objects_collected_total Objects collected during gc
# TYPE python_gc_objects_collected_total counter
python_gc_objects_collected_total{generation="0"} 7154.0
python_gc_objects_collected_total{generation="1"} 1696.0
python_gc_objects_collected_total{generation="2"} 0.0
# HELP python_gc_objects_uncollectable_total Uncollectable objects found during GC
# TYPE python_gc_objects_uncollectable_total counter
python_gc_objects_uncollectable_total{generation="0"} 0.0
...
...
...
5. Run it as a systemd service
To make the exporter start automatically after reboot, it is convenient to run it as a systemd service.
Example unit file:
[Unit]
Description=SqlBak Prometheus Exporter
After=network.target

[Service]
Type=simple
User=<your-user>
WorkingDirectory=/opt/sqlbak
Environment="SQLBAK_API_TOKEN=YOUR_API_TOKEN"
Environment="CHECK_INTERVAL=60"
Environment="EXPORTER_PORT=8000"
Environment="JOBRUNS_LOOKBACK_HOURS=168"
ExecStart=/usr/bin/python3 /opt/sqlbak/sqlbak_grafana_exporter.py
Restart=always
RestartSec=5

[Install]
WantedBy=multi-user.target
Save it as:
/etc/systemd/system/sqlbak-exporter.service
Then run:
sudo systemctl daemon-reload
sudo systemctl enable --now sqlbak-exporter
sudo systemctl status sqlbak-exporter
6. Add the exporter to Prometheus
Now add a scrape target to prometheus.yml:
scrape_configs:
  - job_name: 'sqlbak-exporter'
    static_configs:
      - targets: ['localhost:8000']
If the exporter runs on another host, replace localhost with the proper host or IP address:
targets: ['monitoring-host:8000']
Then reload or restart Prometheus:
prometheus --config.file=prometheus.yml
7. Verify Prometheus targets
After configuring Prometheus, open the Targets page:
http://localhost:9090/targets
You should see your exporter in the UP state:
sqlbak_exporter → http://localhost:8000/metrics- status: UP
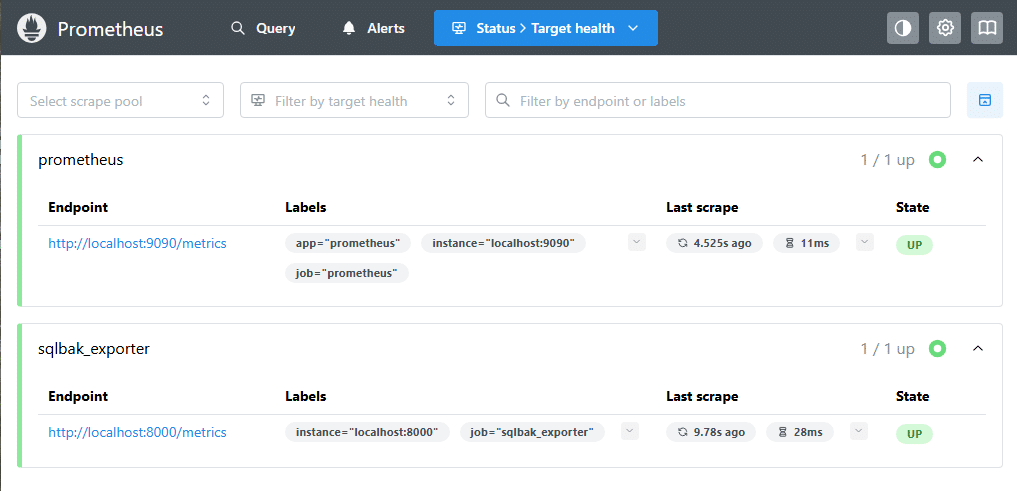
This confirms that:
- the exporter is running;
- Prometheus can reach it;
- metrics are being collected successfully.
At this point, the integration between SqlBak, the exporter, and Prometheus is complete.
8. Connect Prometheus to Grafana
If Prometheus is already configured as a Grafana data source, you can move straight to dashboard creation.
If not, add Prometheus as a data source in Grafana and click Save & Test.
Once that is done, all sqlbak_* metrics will be available for PromQL queries, panels, and alerts.
9. Build a Grafana dashboard
Start with a few basic panels:
- Offline servers →
sqlbak_server_online == 0orsqlbak_offline_servers_total - Last backup age →
sqlbak_job_last_success_age_hours - Failed backups →
sqlbak_job_backups_failed_total > 0 - Retention issues →
sqlbak_job_has_backups_older_than_policy > 0 - Retention settings →
sqlbak_job_retention_days - Exporter health →
sqlbak_last_check_timestamp
Also monitor API availability:
sqlbak_jobruns_available, sqlbak_jobsettings_available
If either is 0, some API data is not available.
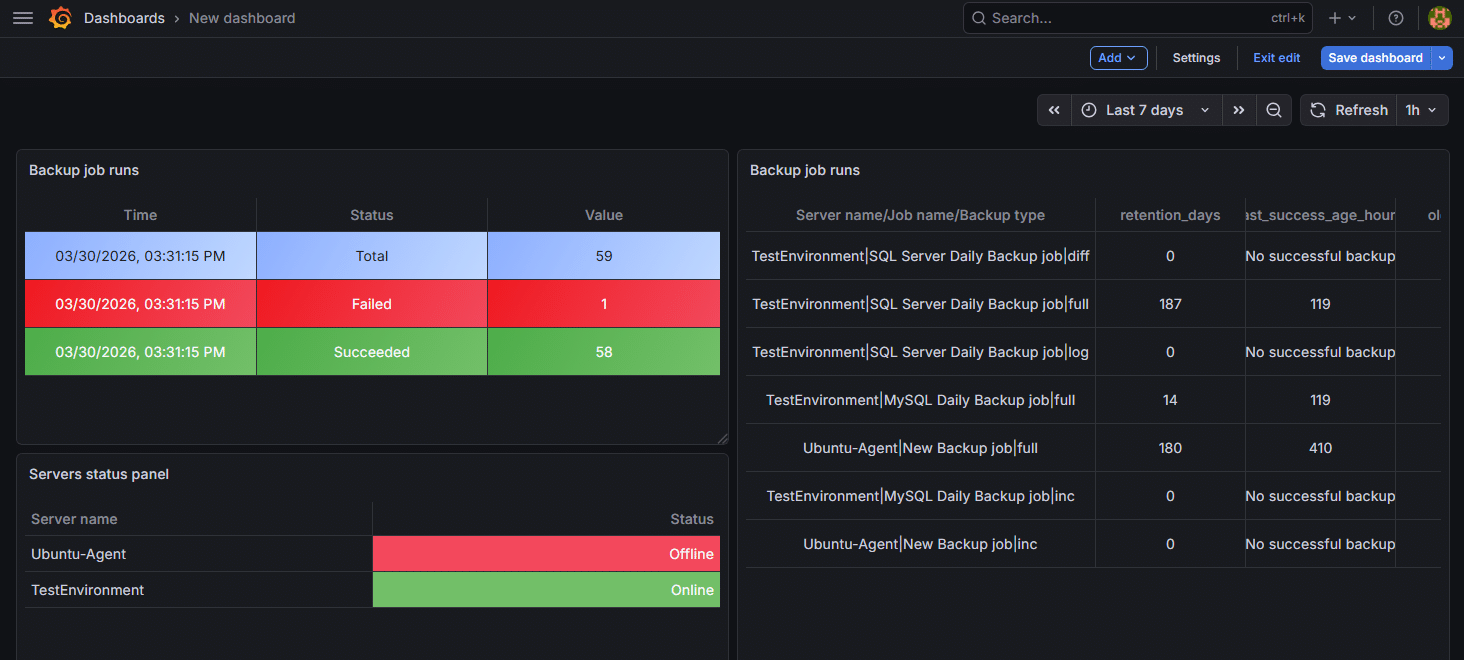
10. Use the summary metric for Grafana tables
The sqlbak_job_summary metric is designed to make it easier to build compact tables in Grafana.
In Grafana, use the following query:
sqlbak_job_summary
Each row represents a combination of:
- server (
server_name) - job (
job_name) - backup type (
backup_type, for example full, diff, log)
The metric label defines what value is shown:
retention_dayslast_success_age_hoursold_backups
This allows you to display multiple related values in a single table, instead of creating separate panels for each metric.
11. Configure alerts
With these metrics, you can set up basic alerts for:
- exporter not updating
- offline servers
- failed backups
- retention policy violations
- missing recent backups
In practice, thresholds should be adjusted depending on your backup schedule (for example, stricter for log backups and more relaxed for full backups).
Production considerations
A few practical notes for production use:
-
API load
The exporter queries jobs, settings, and job runs. In larger environments, adjustCHECK_INTERVALandJOBRUNS_LOOKBACK_HOURSto avoid unnecessary load. -
Metric cardinality
Metrics use multiple labels (server, job, backup type). This is fine in most cases, but should be monitored in large deployments. -
Scope of monitoring
Folder backups are currently excluded from job-level statistics. -
Partial failures
If some API endpoints are unavailable, the exporter continues working and exposes this viasqlbak_jobruns_availableandsqlbak_jobsettings_available.
Conclusion
Integrating SqlBak with Grafana can be very straightforward. A small Python exporter can periodically read the SqlBak API and expose the results as Prometheus metrics. Prometheus scrapes those metrics, and Grafana turns them into dashboards, tables, and alerts.
The key benefit is that backup monitoring becomes part of your overall observability stack. You can immediately see offline agents, failed or outdated backups, and retention issues — all in the same place as your infrastructure metrics.