We have updated the SqlBak Dashboard – this is the main control panel where users can see all of their backup jobs on a single page. The new features will be particularly useful for customers who have many DBMS backup jobs. Let’s take a look at how these new features can make your life easier.
Summary Numbers and Sorting
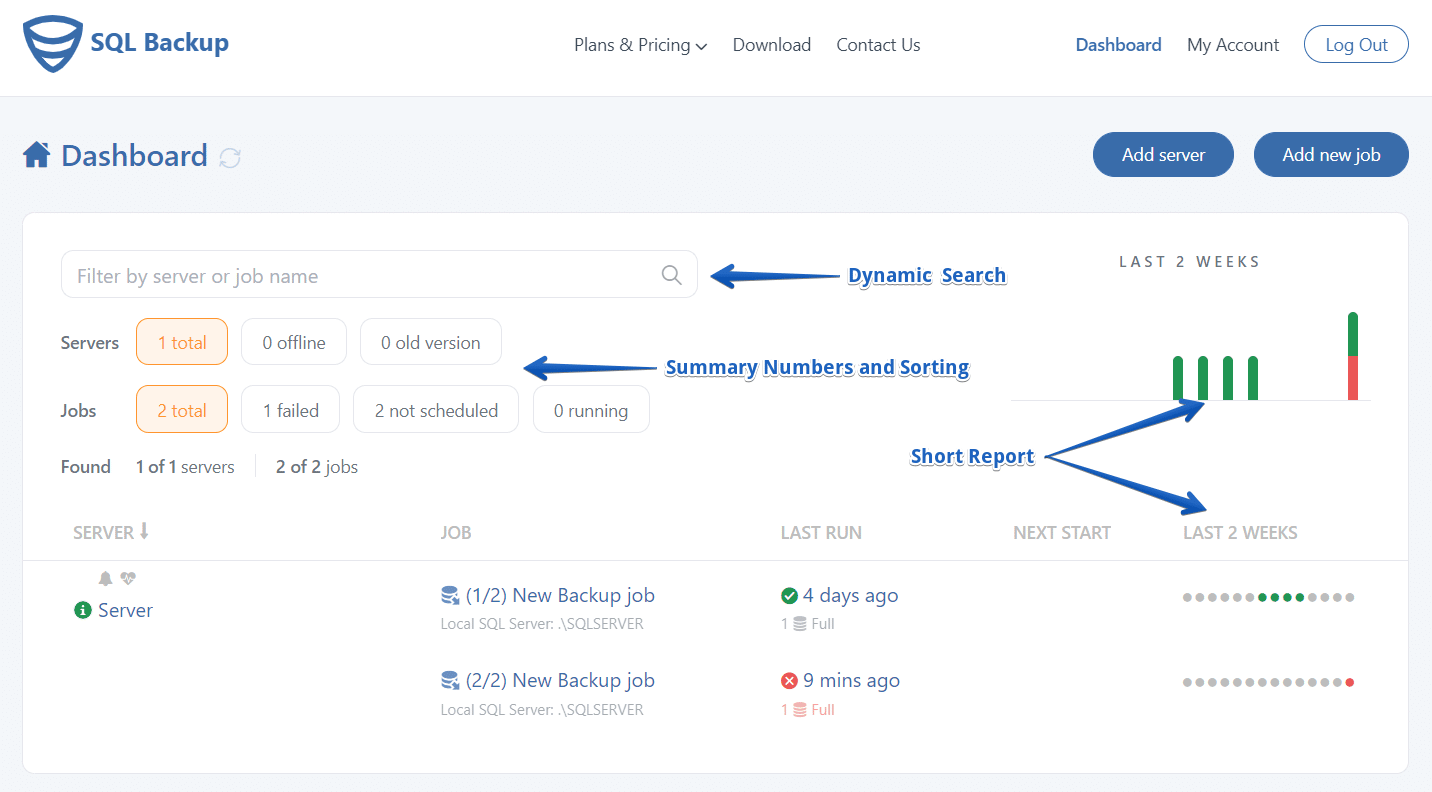
If you had a large number of jobs, it may have been difficult to see their overall status. In particular, it was hard to see how many of jobs failed and need your attention. Now you just need to look at the “failed” number at the top of the dashboard.
The sorting feature also helps you to deal with a large number of jobs on your list. For example, if you click on the “failed” link only failed backup jobs will be displayed. In the same manner, you can easily find all offline servers by clicking the appropriate link.
Dynamic Search
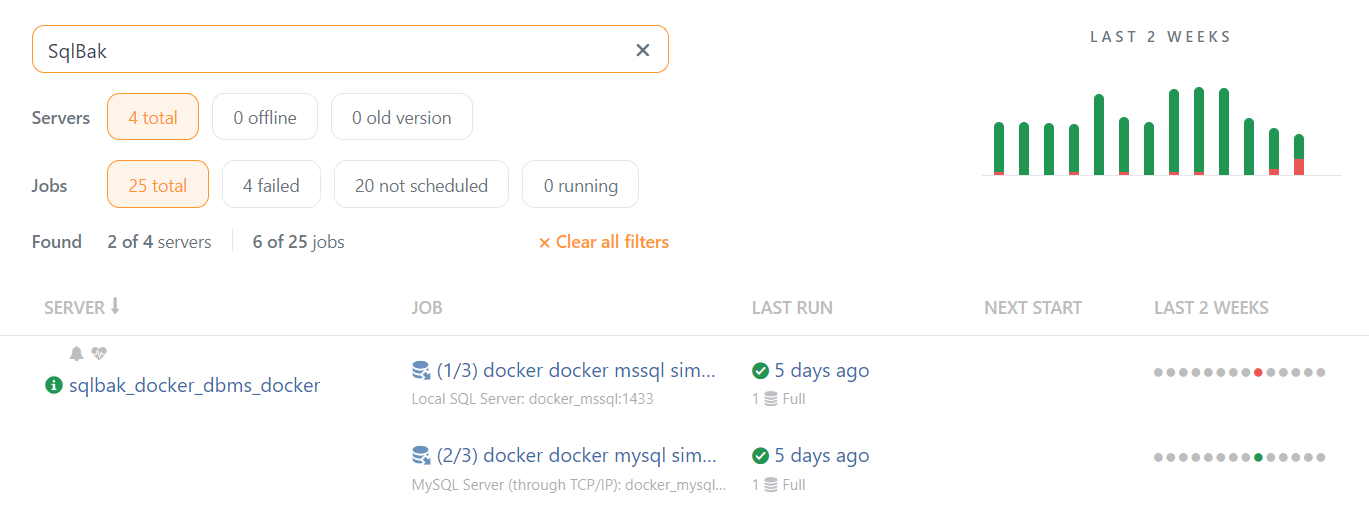
Before if you had a lot of jobs it was not very convenient to manage them due to the long list and some customers asked us for job grouping or tagging options. Now with the advanced job search/filter control, you can easily reduce the job list by showing only those rows that contain a certain text in their job or server name.
The filter is applied dynamically as you type the search text.
Short Report
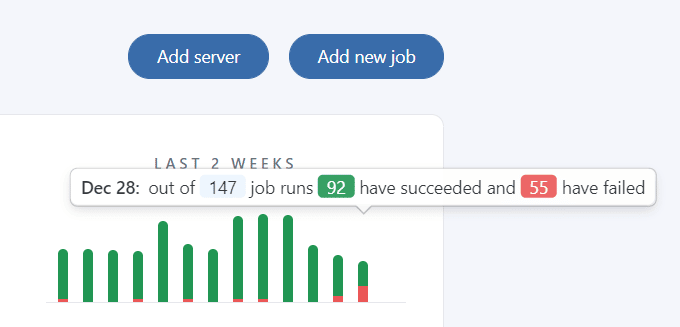
This is a new option that allows you to check the short report of all your jobs for the last four weeks. Just hover over the week you need and you’ll see the short report.
Also, the more detailed report for each job can be found in the LAST 2 WEEKS column.
We hope you will like all these innovations. If you have any questions or suggestions don’t hesitate to ask right here in the comments.


