SQL Server health checks and backups often seem secondary to the primary business objectives. And, generally, it is so until your server is down or the data is lost. Only then the true importance of automating these mundane SQL Server maintenance tasks become apparent.
SqlBak.com is there to take care of such “secondary” issues and make sure that database admins don’t have to think about it. That is why on top of backup services we added the SQL Server Automatic Health Check option.
In this article, we are going to explore the key aspects of this service and show how can they be useful to you in terms of database administration.
Monitoring Free Disk Space
Have you ever found yourself in a situation when there’s no free disk space on your server? Truth be told, it is quite an unpleasant situation. The system is slow, you get multiple errors, and some apps just won’t run.
It may happen due to the expansion of logs, undeleted temporary files, improper bulk information copying, etc. But the main thing – such a situation can be easily tracked down and prevented.
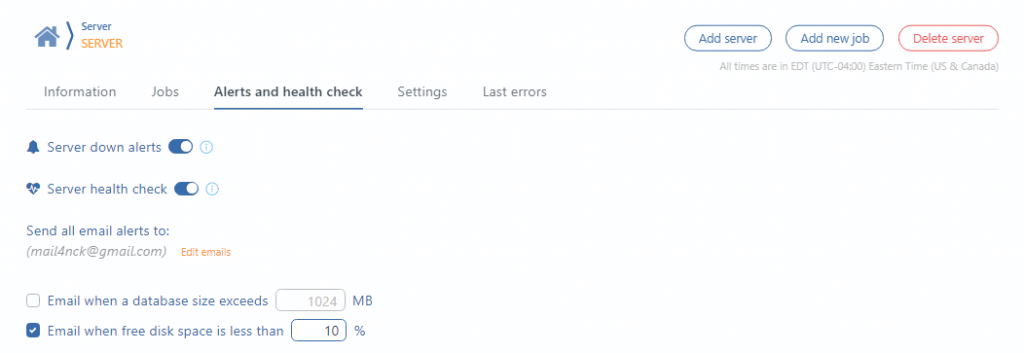
For that go to the “Alerts and health check” tab at your Server settings page and set the free disk space threshold (percentage) and the service will automatically alert you when the space level drops below this level:

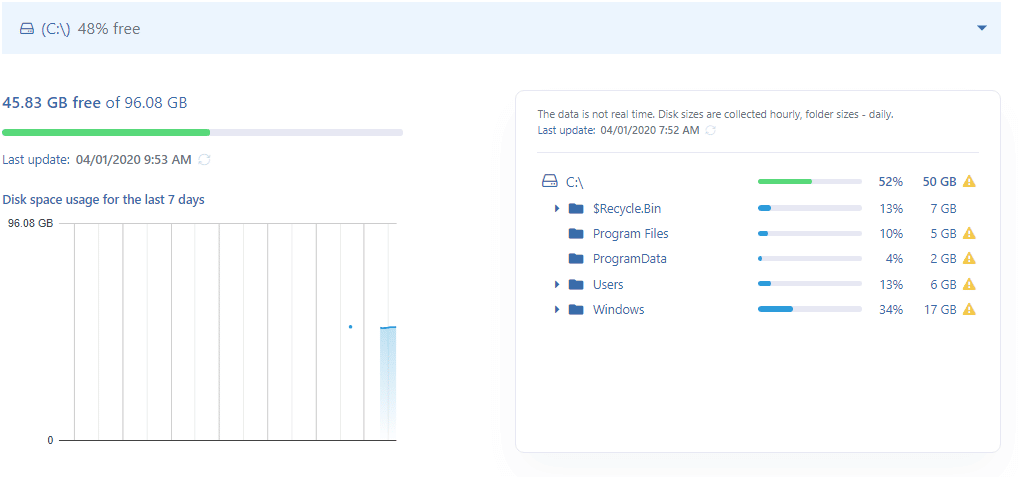
And the most pleasant thing of all is that SqlBak.com interface shows exactly what takes so much space by showing the size of folders on the server:

In addition, as seen on the screenshot, disk use history is also kept which can help detect trends and anomalies and prevent future downtime.
Database Monitoring
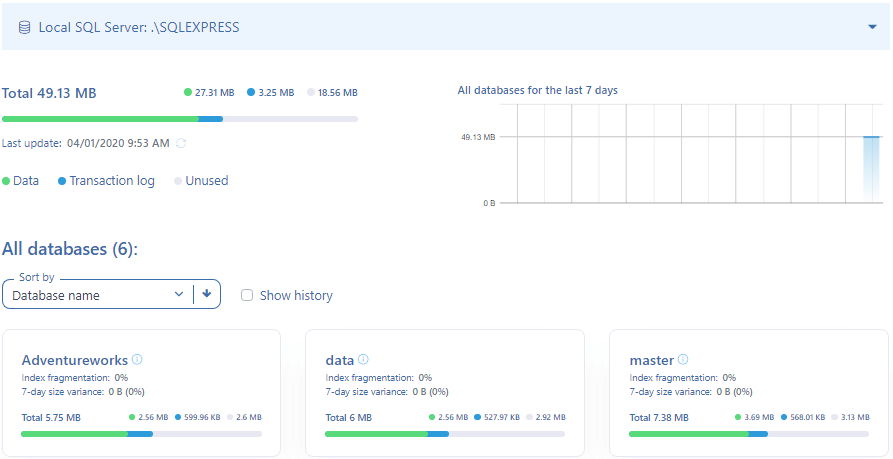
Another section of SQL Server Automatic Health Check is dedicated to monitoring certain parameters of a database on each server that is connected:

Here you can see aggregate data for all databases on the server, information about each database as well as the size change history of each database within the last 30 days.
Now let’s take a closer look at some crucial parameters from that list.
Transaction Log Size
The transaction log records all changes in data made in each transaction. It is a very important part of the database which can help bring it back to a consistent state in case of error.
However, in some cases transaction log can grow fast and requires regular truncation to avoid overflow. That being said, its truncation may be postponed for a number of reasons and that is why it is really necessary to monitor the log’s size.
Usually, transaction logs are truncated automatically or upon reaching the control point (in a simple recovery model) or following the transaction log backup (in case of full and bulk-logged recovery model). However, some factors can cause the delay in transaction log truncation, and then it will continually increase and can occupy all the available disk space.
On top of the increase in the number of records, a transaction log file can simply contain some substantial amount of unused space. In this case, you can save space by decreasing the file size. It is called log file shrinking and can be performed using the following command (usually executed after truncation):
DBCC SHRINKFILE (MyDB_Log, 1);
The first parameter is the transaction log file logical name; the second one – its size in megabytes (whole number). It can be omitted and then the file will shrink to its default size.
Unused Space
As a result of deleting operations, database files can have plenty of unused space. It means that the database on disk will occupy much more space than the data it actually contains. In this case, you need to shrink the database:
DBCC SHRINKDATABASE (MyDB, 10);
The first parameter is the database name; the second parameter is the amount of free space in this database in percentage terms.
Index Fragmentation
Such operations as insertion, update, or deletion may lead to data in index being scattered all over the database (fragmented). In addition, fragmentation can occur when indexes contain pages for which logical order, based on key-value, does not agree with a physical order in the data file.
Substantially fragmented indexes can dramatically reduce query performance and thereby lead to overall slow performance of the application. In this case, you need to rebuild indexes.
This is done using ALTER INDEX command. For example, all indexes in MyDB.MyTable can be rebuilt by executing the following command:
ALTER INDEX ALL ON MyDB.MyTable
REBUILD WITH (FILLFACTOR = 80, SORT_IN_TEMPDB = ON,
STATISTICS_NORECOMPUTE = ON);
Database Size Threshold Exceeded Notification
Similar to notification about not enough free disk space, SqlBak.com can also notify you when the database size exceeds a certain threshold. It’s particularly handy if you use SQL Server Express Edition that does not allow working with databases over 10GB in size.
However, even if you have a full-fledged SQL Server version, in some projects it is really useful to monitor database growth. Especially when it occurs due to continually expanding transaction log as discussed above.
Bottom Line
If you use SqlBak.com to backup your databases then you will definitely get notified about issues with backup copies or server downtime. But since prevention is better than the treatment we strongly encourage you also to include the SQL Server Automatic Health Check option to make sure you are notified when things go wrong.
