Any SQL Server DBA worth their salt has its own checklist through which they routinely go to make sure that all systems are up and running. Below we will share with you some crucial points related to SQL Server health checks.
Here we will discuss two ways, how to compose a SQL Server health check checklist. You can perform all checks manually, using T-SQL Commands, or simply use Automated Health Check from SqlBak. Here it goes.
☑ SQL Server Service Health Check
The first thing you need to ensure is that all your SQL Server services are alive. Of course, if you are able to successfully connect to SQL Server instance it means that it is alive, but still, you can check the status of all your SQL Server services using the following commands:
exec master.dbo.xp_servicecontrol 'QUERYSTATE', 'MSSQLServer'
exec master.dbo.xp_servicecontrol 'QUERYSTATE', 'SQLServerAgent'
exec master.dbo.xp_servicecontrol 'QUERYSTATE', 'SQLBrowser'
Here you can check which services are running and which stopped: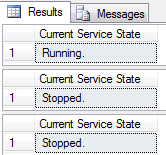
Of course, it’s a bit weird to run this query manually every hour, isn’t it? As a developer, you should probably think about creating some simple application or a batch file that will check the status of your SQL Server and notify you if something goes wrong.
SqlBak users don’t need any additional applications though. It performs regular checks and sends alerts in the event of service failure.

☑ SQL Server Backup Health Check
Another thing you need to check is database backups. Again, you can do it either manually or with SqlBak.
To check it manually you can use the following two useful queries. The first one checks your full backups and the second one checks all transaction log backups:
SELECT d.name AS "Database",
 ISNULL(CONVERT(VARCHAR,b.backupdate,120),'NEVER') AS "Last Full Backup"
FROM sys.databases d
LEFT JOIN (SELECT database_name,type,MAX(backup_finish_date) backupdate FROM backupset
 WHERE type LIKE 'D'
 GROUP BY database_name,type) b on d.name=b.database_name
WHERE (backupdate IS NULL OR backupdate < getdate()-1)
SELECT d.name AS "Database",
 ISNULL(CONVERT(VARCHAR,b.backupdate,120),'NEVER') AS "Last Log Backup"
FROM sys.databases d
LEFT JOIN (SELECT database_name,type,MAX(backup_finish_date) backupdate FROM backupset
 WHERE type LIKE 'L'
 GROUP BY database_name,type) b on d.name=b.database_name
WHERE recovery_model = 1
 AND (backupdate IS NULL OR backupdate < getdate()-1)
As a result, you will see a list of databases that either do not have any backups at all or have not been backed up in the past 24 hours:
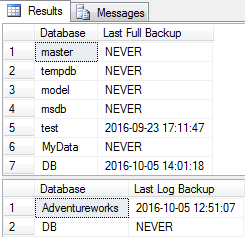
However, if you use SqlBak to backup your databases, you don’t need to check your SQL Server database backups manually all the time. You will be notified automatically if any of your scheduled backups failed.
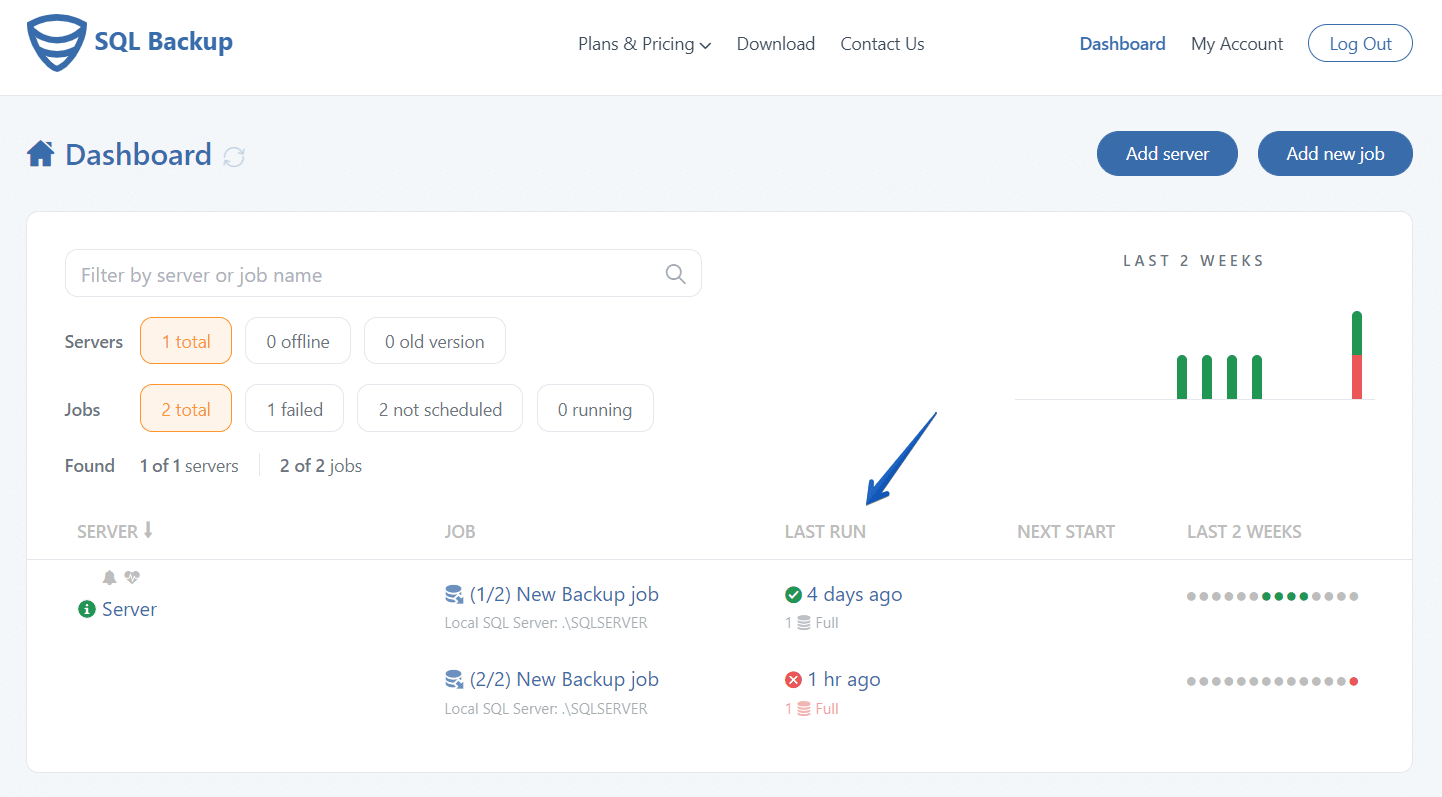
At the same time, if you want to see the status of all backup jobs you can open your Dashboard page and check the “Last Run” column. If the last backup succeeded, it would be marked as a green checkmark, or a red cross if it failed.
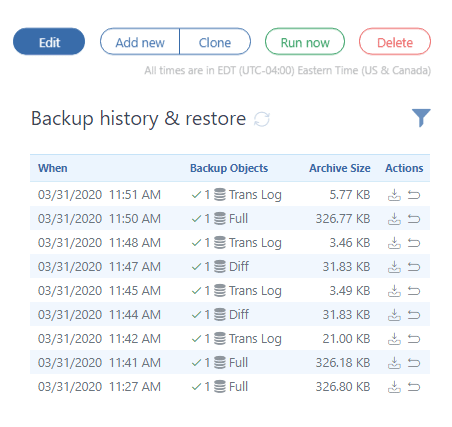
In addition, you can check the entire database backup history by clicking on the backup job you need:
☑Check for Available Disk Space
One of the trickiest problems DBA may face is insufficient disk space. If you run out of free disk space it will not only slow your server down but also may cause multiple errors and application failures. And the most dangerous thing here is that it may happen when you least expect it (for example in the midst of your vacation).
You can check free disk space using a simple Windows command:
fsutil volume diskfree c:
or with a bit more complicated WMI command:
wmic /node:"%COMPUTERNAME%" LogicalDisk Where DriveType="3" Get DeviceID,FreeSpace|find /I "c:"
If you need you can check how much free disk space is left using the following SQL Server statement:
exec master.dbo.xp_fixeddrives

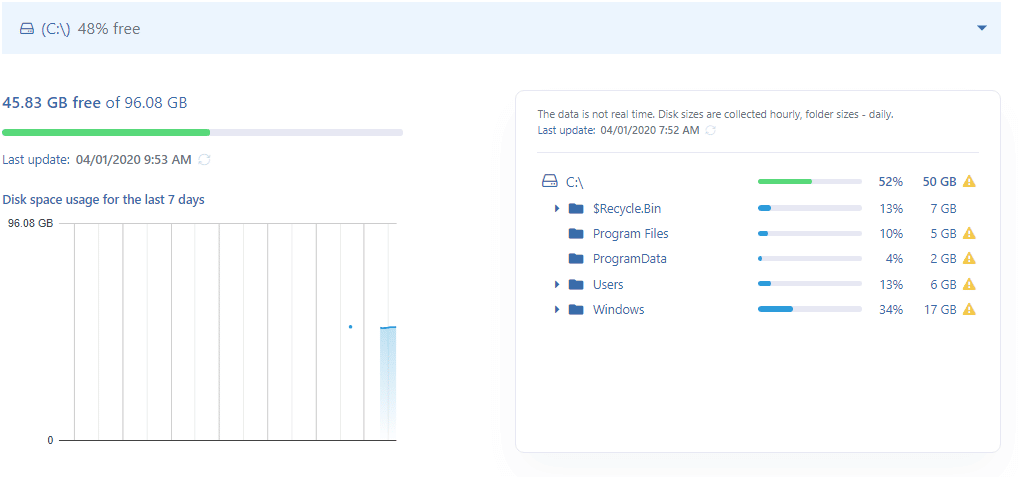
But why not let SqlBak do it for you automatically? It has a nice feature that will perform hourly checks and alert you via email when free disk space crosses the threshold you set.
Additionally, SqlBak’s Health Check dashboard allows you to easily determine what folders and files occupy your disk. It can be found at your server settings page at the “Alerts and health check” tab:
☑ Check for free memory available for SQL Server
Besides monitoring the server’s free disk space you also need to take note of how much free memory is available on your server. If the amount of free memory is approaching some critical value you need to take steps to free it.
To check your server’s memory with SQL you can use the following syntax:
SELECT available_physical_memory_kb/1024 as "Total Memory MB",
 available_physical_memory_kb/(total_physical_memory_kb*1.0)*100 AS "% Memory Free"
FROM sys.dm_os_sys_memory

☑ Check the size of the transaction log
The transaction log is one of the crucial aspects of every database. It is used to keep all transactions prior to committing the data into the data file. Depending on the number of transactions it may happen that transaction logs grow quite large and not knowing what is in the transaction log or how much space is occupied by it can cause some problems.
To get the size of transaction logs you can run the following query:
DBCC SQLPERF(LOGSPACE)
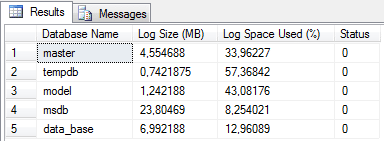
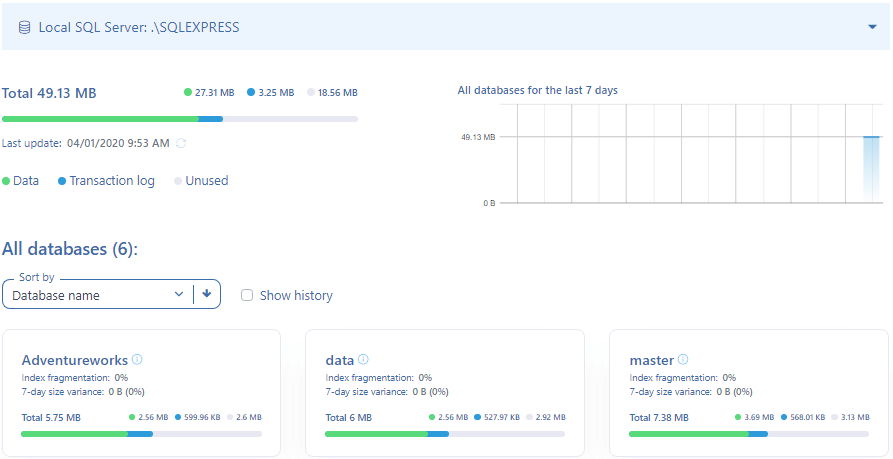
SqlBak Automatic Health Check can help you here as well as it monitors how much space does the transaction log occupy for each database:
☑ Check for Index Fragmentation
Besides fragmentation at the file system level, it’s also possible to have fragmentation within the data and log files, in the structures that store the log, table, and index data. This also may lead to a significant drop in database performance.
SELECT OBJECT_NAME(OBJECT_ID), index_id,index_type_desc,index_level,
avg_fragmentation_in_percent,avg_page_space_used_in_percent,page_count
FROM sys.dm_db_index_physical_stats
(DB_ID(N'<YOUR DATABASE>'), NULL, NULL, NULL , 'SAMPLED')
ORDER BY avg_fragmentation_in_percent DESC
and you will get basic information about external fragmentation percentage and an average percentage of use of pages that represents the internal fragmentation.
And as shown in the screenshot above, SqlBak’s SQL Server Health Check also provides information about index fragmentation.
Is Anything Missing?
Ok, that’s all I wanted to tell you. If there’s anything missing from this list, please leave your suggestion in a comment and we’ll consider adding it to the list.
Thank you for reading and sharing!

AVG health is missing, Job status is missing aso…
Hi Michal,
Thank you for your request. We’ll consider it.
Could you please clarify what else will be useful to add to the monitoring option?
Note, you can find your jobs’ status at the “Dashboard” https://sqlbak.com/dashboard/ page.
1- Check Backup
2- Check SQL jobs running on SQL agent
3- Check SQL error log for last week
4- SQL Windows Event viewer for last week
5- Check Disk space
6- Check top 10 Queries with high CPU and high Execution time
7- Check missing index
8- Check unused index
9- Check index Fragmentation
10- Check index Statistics
11- Check Failed login
12- Check DB Log Size
13- Check Always-on Status and any other replication such as Mirroring, replication, Log Shipping
14- Check Database Sync status
PLease can you send all the complete scripts to stanleyjf@gmail.com